Flash video is so great.
Anyway I used to use MediaCoder to convert to flash video, but when it gave me errors, and refused to tell me the specifics of those errors, I took it old school to the command prompt with FFmpeg (which MediaCoder uses anyway). This gives you a lot of useful info about the source file you’re encoding, such as audio sampling rate, frame rate, etc.
Wanting to find a balance between picture quality and streamability, I began encoding a short length of AVI video at different compression levels. FFmpeg calls this “qscale” (a way of representing variable bitrate qualities, much like LAME‘s -V parameter), and the lower the qscale value, the better the quality. The available qscale values range from 1 (highest quality) to 31 (lowest quality). Going worse than a 13 qscale produces unacceptably poor quality, so that’s as low as I went for the purposes of this test.
I encoded 3:14 minutes of an AVI, resizing it to 500Ã — 374 pixels, and encoding the audio at 96kbps and 44.1KHz, which sounds fine, and is a negligible part of the ultimate file size, so going lower wouldn’t be very beneficial. Plus I find that good audio can create the illusion that the whole thing is of higher quality. Poor audio just makes it sound like “web video.”
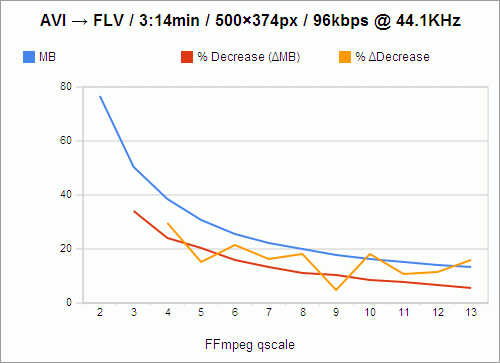
Here are the results, courtesy of Google Spreadsheets:

The filesize, of course, goes down as quality goes down. And the loss in filesize also decreases, not just in amount, but in percentage as well, as indicated by the red line. For instance, the value of the red line at qscale 3 is 33.97%, which means that in going from qscale 2 to qscale 3, 33.97% of the filesize is shaved off.
However, because these losses are not perfectly exponential, I knew that there had to be qscale values that were more “efficient,” in a sense, than others — values that, despite being high, and causing a lower change in filesize than the previous step in qscale, still caused a comparably large change in filesize. For instance, still looking at the red line, you’ll notice that going from 2 to 3, as I said, shaves off 33.97% of the filesize, while going from 3 to 4 only shaves off 23.93% of the filesize; and that is a 29.56% decrease in change-in-filesize, which is a relatively large cost. We want the change-in-filesize to remain as high as possible for as long as possible.
Now, if you follow the red line from 4 to 5, you’ll see that that’s a 20.32% loss in filesize, which is pretty close to our previous 23.93% loss in filesize in going from 3 to 4. In fact, we’ve only lost 15.09% of change-in-filesize from the previous step. So these are the values we really want to examine: change in change-in-filesize, represented by the orange line.
This is nowhere close to exponential, nor does it follow any predictable decline. It darts around, seemingly at random. And we want to catch it at its lowest values, at points that represent changes in qscale that were nearly as efficient as the previous change in qscale. So the most desirable qscale values become, quite obviously, 5, 9, and 11.
What this means is that if quality is your primary concern (and you’re not crazy enough to encode at qscale 1), go with 5. qscale 5 turns 3:14 minutes of video into 30.62MB, which requires a download rate of 157.84KB/s to stream smoothly. qscale 11 will give you about half the filesize, and require a download rate of 77.37KB/s. But, because that’s the level at which picture quality really begins to suffer, and because most people don’t really mind buffering for a few seconds initially, I’m probably going to stick with qscale 9, whose videos take up 91.58 kilobytes per second, and which is by far the most efficient qscale anyway, with only a 4.92% change in change-in-filesize.
One caveat: This whole examination presupposes (as far as I can tell) that if it were possible to measure and chart the changes in the actual perceived visual quality of videos encoded at these qscale values, the curve would be perfectly geometric or exponential, with no aberrations similar to those above, and with all extrapolated delta curves showing no aberrations either. Given that, it might be easier to believe that every step you take through the qscale is of equal relative cost, and that there are no “objectively preferable” qscale values. But that is a lot more boring.